How To Read A Carson City Housing Market Report
July 16, 2026
July 16, 2026
Wondering why one Carson City housing market report says homes are moving fast while another makes the market look slower? You are not imagining things. Real estate data can feel confusing when different sources show different numbers, especially if you are trying to decide when to buy or sell. The good news is that once you know what each metric means and how to compare reports, the picture gets much clearer. Let’s dive in.
The first step in reading any Carson City housing market report is to check what homes are included and what time period the report covers. That context matters because not every report is measuring the same thing.
For example, the Sierra Nevada REALTORS® June 2026 report covers Carson City single-family homes in a single month. In that report, the median sales price was $577,000, median days to contract was 17, list-price received was 98.5%, there were 81 active listings, and inventory stood at 1.4 months.
Public real estate portals can look very different. Realtor.com’s June 2026 Carson City page showed 433 active listings, a median listing price of $598,387, a median sold price of $512,495, 36 median days on market, and a 100% sale-to-list ratio. Redfin’s Carson City page for the three months ending May 2026 showed a $489,697 median sale price, 44 median days on market, and a 99.0% sale-to-list ratio.
That does not automatically mean one source is wrong. It usually means the reports are using different property mixes, data sets, and time windows.
This is one of the biggest points to understand. A housing report is a snapshot, not a universal scorecard.
The local MLS-based report is focused on a narrower slice of the market, while public portals often pull broader citywide data. Redfin also uses a rolling three-month view, which smooths out short-term swings but can make the market feel slower or more stable than a one-month report.
That is why you should compare like with like. A median sales price from a single-family MLS report should not be treated as the same thing as a citywide median listing price from a portal.
Median sales price is one of the most talked-about numbers in any housing report. It is also one of the easiest to misunderstand.
The median is the midpoint of all sales. Half of the homes sold for more, and half sold for less. That is different from an average, which can be pushed higher or lower by a few unusually expensive or unusually low-priced sales.
In Carson City’s June 2026 MLS report, the median sales price was $577,000. That was up 4.9% from May 2026 but down 3.8% from June 2025.
That is a great example of why one number never tells the whole story. If you only looked month over month, you might say prices were rising. If you only looked year over year, you might say prices were softening. Both statements can be true at the same time, depending on the comparison.
Days on market, or time to contract, helps you understand how quickly homes are finding buyers. In simple terms, it measures how long a property was listed before going under contract.
In Carson City, the local June 2026 report used median days to contract, which came in at 17 days. Realtor.com showed 36 median days on market, while Redfin showed 44 days on market over the prior three months.
Again, those numbers are not necessarily in conflict. They reflect different definitions, time windows, and property pools.
A lower number usually points to stronger buyer demand or pricing that is aligned with the market. A higher number can suggest a slower pace, but it can also reflect homes that were priced too high, needed updates, or appealed to a narrower group of buyers.
If days on market is falling, homes may be moving faster and buyers may have less time to decide. If days on market is rising, you may see more room for negotiation.
Still, this metric works best when you read it alongside price, inventory, and sale-to-list ratio. On its own, it is only part of the story.
Months of inventory is one of the clearest ways to understand market balance. It estimates how long it would take to sell the current inventory at the current sales pace, assuming no new listings come on the market.
Carson City’s June 2026 MLS report showed 1.4 months of inventory for single-family homes. A six-month supply is often considered a balanced market, so 1.4 months suggests a relatively tight market in that segment.
When inventory is low, buyers usually have fewer choices and may face more competition. When inventory rises, buyers often gain more options and more negotiating room.
Because this is a ratio, it can change quickly. If listings increase or sales slow down, months of inventory can move fast from one report to the next.
The list-to-sale ratio tells you how close homes are selling to their asking price. It does not tell you whether the asking price was smart to begin with.
In Carson City, recent public-facing numbers were all fairly close to list price. The Sierra Nevada REALTORS® report showed 98.5% list-price received, Redfin showed 99.0%, and Realtor.com reported 100% sold-to-ask.
That suggests many homes are still selling near their final asking price. At the same time, Redfin reported that 24.8% of Carson City homes sold above list price, which shows that averages can hide a range of outcomes.
A house can sell at 100% of list and still be overpriced compared with similar homes. A house can also sell below list and still be fairly priced if it started too high.
The best way to read a Carson City housing market report is to treat the numbers like pieces of one puzzle. A single metric can be misleading if you view it alone.
Here is a simple way to think about it:
These are rule-of-thumb reads, not guarantees. The mix of homes sold in a given month can change the picture.
Citywide data is helpful, but it can blur what is happening in different parts of Carson City. That matters if you are buying or selling in a specific area.
For example, Realtor.com’s June 2026 zip code figures showed median listing prices of $475,000 in 89706, $490,000 in 89701, $699,990 in 89705, and $719,950 in 89703. That is a wide spread within the same city.
This is why local interpretation matters. A citywide median may be useful for headlines, but your pricing or offer strategy should reflect the homes that actually compete with the one you want to buy or sell.
Housing activity tends to move with the seasons. Spring and summer are often more active, while winter can be slower.
That means a one-month jump or drop does not always signal a lasting trend. In Carson City, a smart reading of the market should look at both month-over-month and year-over-year changes.
The June 2026 Carson City report is useful partly because it shows both. That helps you separate a short-term seasonal shift from a bigger market pattern.
If you want a practical checklist, use this every time you look at a Carson City housing market update.
If you are a buyer, a market report can help you understand how quickly you may need to act and how much negotiating room you might have. If you are a seller, it can help you think more clearly about pricing, timing, and how much competition your home may face.
The key is not to chase headlines or overreact to one number. The real value comes from reading the full picture with the right local context.
That is where a local advisor can make a big difference. When you match market data with neighborhood-level insight, pricing strategy, and real-time inventory, you can make more confident decisions in Carson City.
If you want help understanding what the latest Carson City numbers mean for your move, connect with Heidi Mcfadden. With deep local experience, strong market knowledge, and hands-on guidance for buyers and sellers, she can help you turn the data into a clear plan.
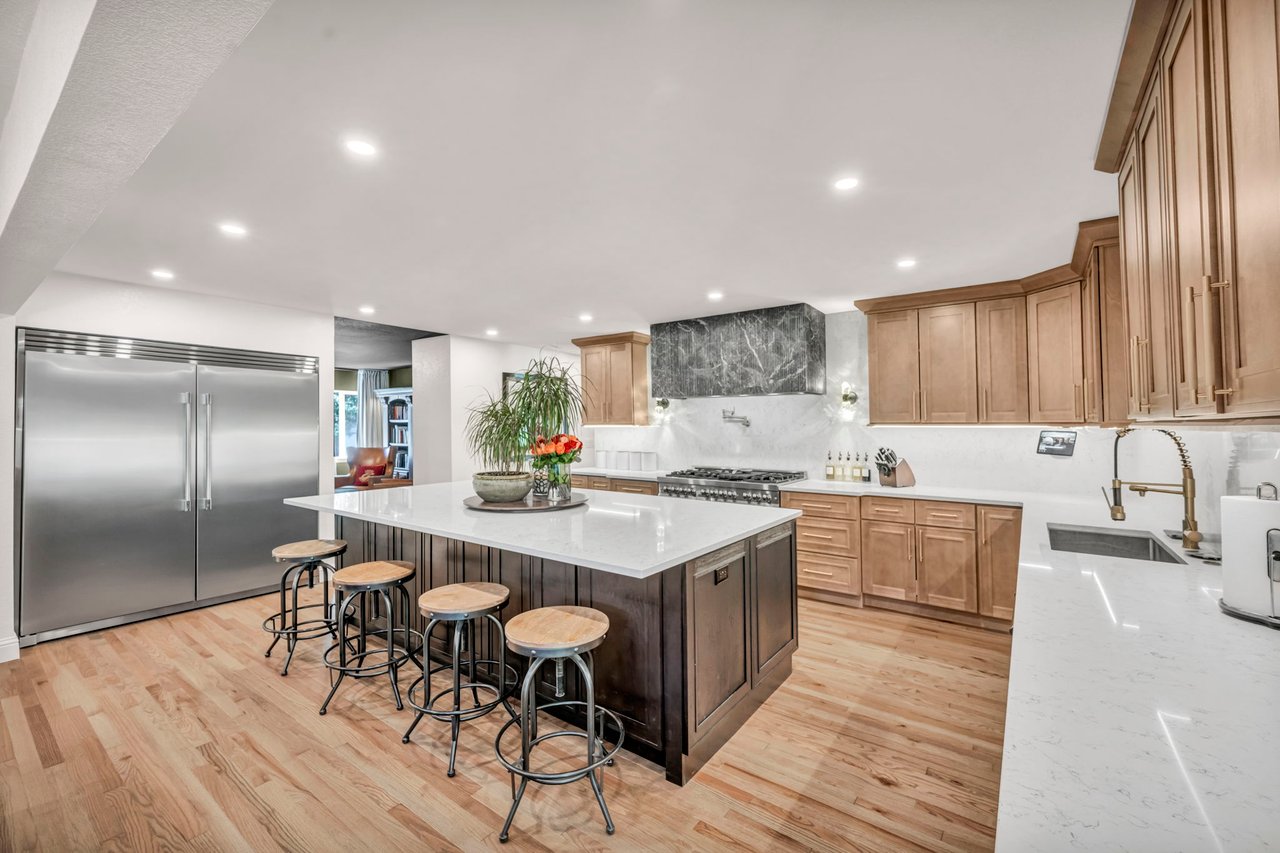
3233 Harvard Drive in Carson City, Nevada
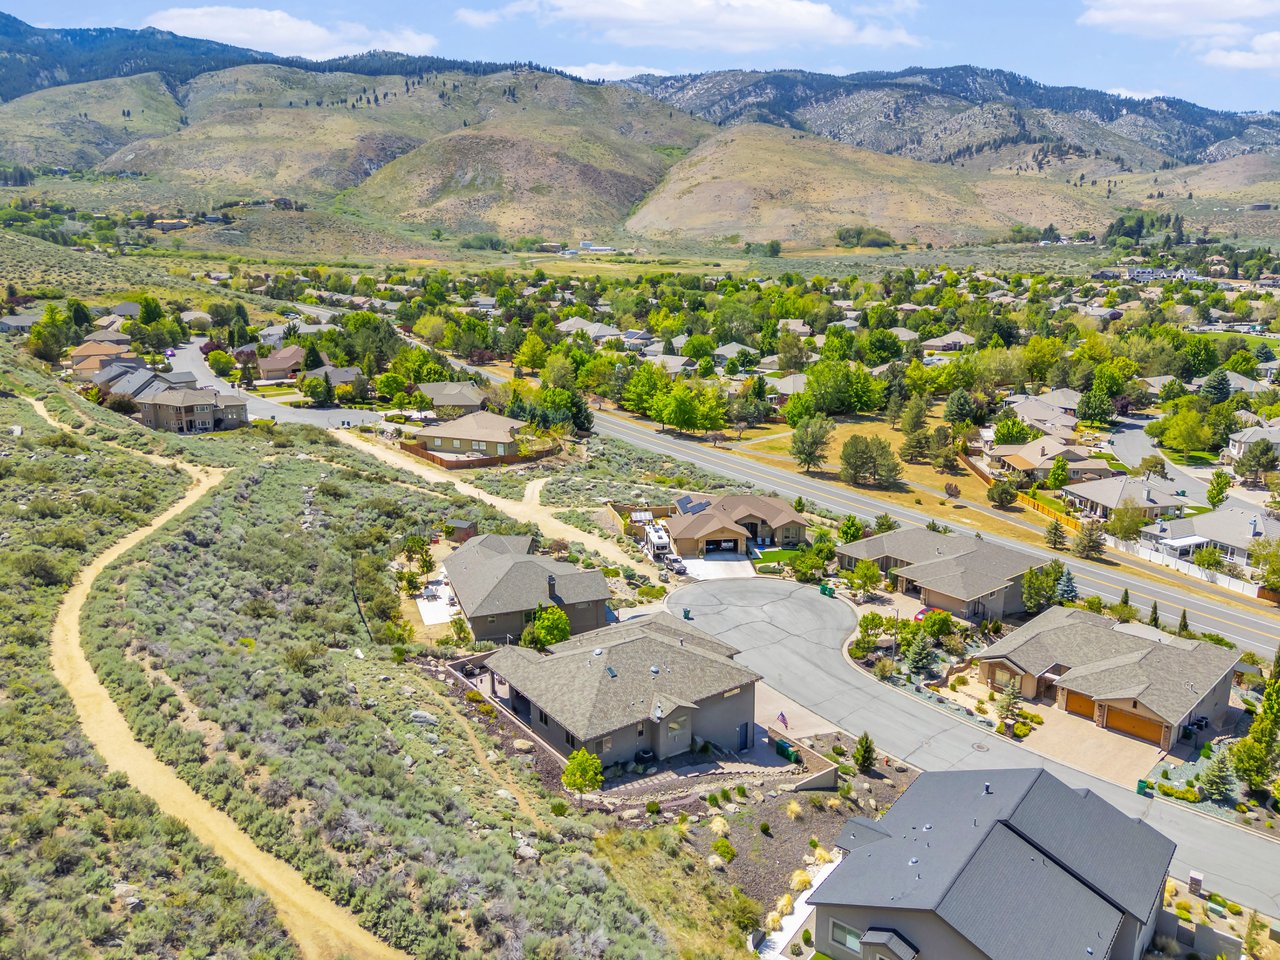
Life in Nevada
Some homes check the boxes. Others create an experience.
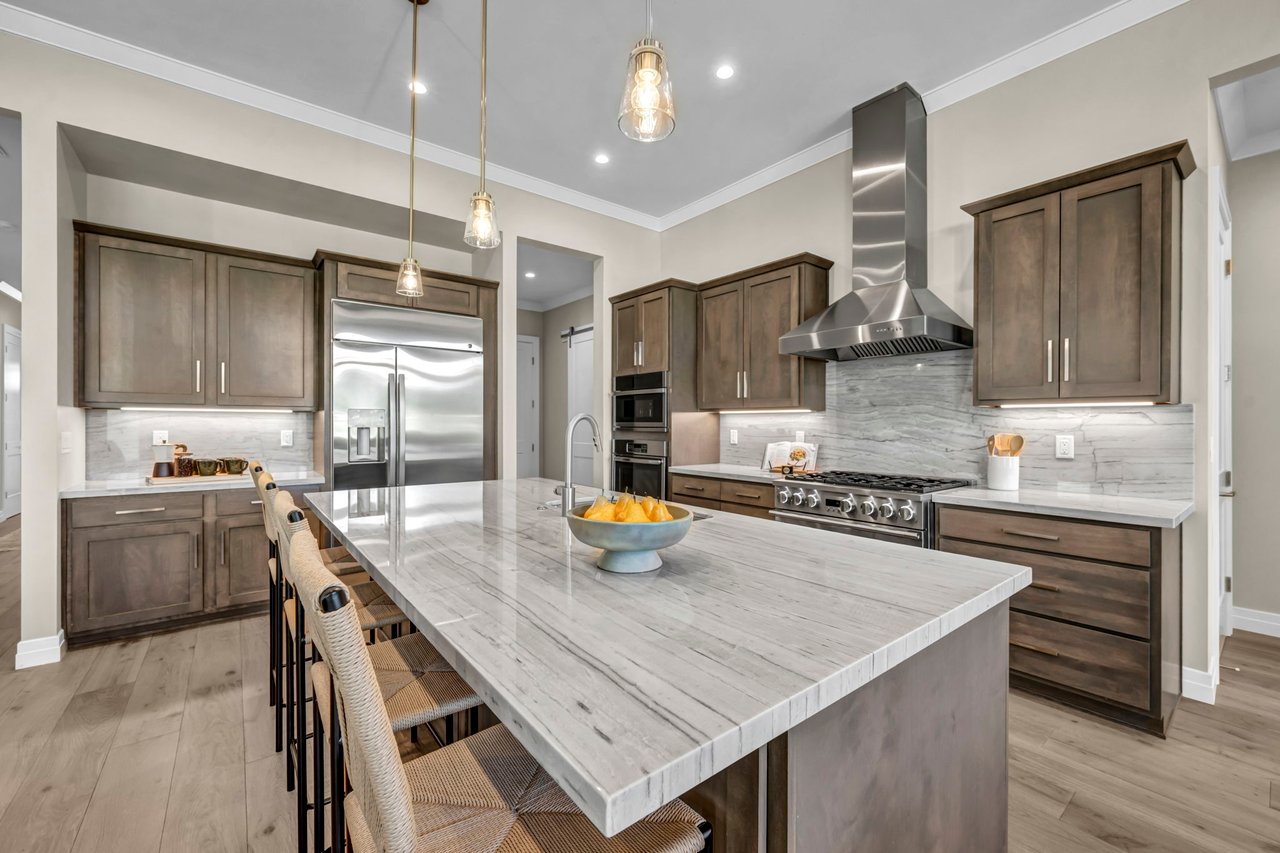
Model 1 is now complete!
Whether you are looking for a luxury estate or a horse property, Heidi is the specialist you need. She combines her professional real estate acumen with a personal passion for the equestrian lifestyle. Connect with her to navigate the unique Northern Nevada landscape with confidence.